Q4E Case Study 28 – Under 20° of rotation the accuracy of data collected by 2D software is maintained ?
|
Proposed subject useage
|
||
|
Sports Science (Degree Yr 1st/2nd and 3rd year) |
Introduction
This study was undertaken in order to validate the Quintic two-dimensional software. Unlike three-dimensional biomechanics software it is essential in two-dimensional software that the activity/participant is recorded perpendicular to the camera to ensure data is collected in the correct plane.
Physical activity can cause markers attached to soft tissue skin/muscles) to move differently to the underlying bone (Benoit et al. 2005). Other errors associated with biomechanical data collection that can lead to inaccuracies include; inability to consistently locate the centre of a tracking marker and errors associated with the smoothing process of the data (Nielsen and Daugaard 2008). Two-dimensional data can be considered accurate when the camera is positioned perpendicular to the plane of action, and the action stays within this plane (Churchill, Halligan & Wade (2002). Parallax error occurs when the participant/movement rotates from the original plane of action. Kirtley (2006) suggested that aligning the optical axis with the centre of the motion would minimise the affect of this error. For two-dimensional data to be accurate the movement must occur within the calibrated (known distance) plane. If the activity does not occur within this plane then perspective errors, or out-of-plane errors can occur. If the movement is situated closer or further away from the calibrated plane the measurements (lengths) will be incorrect and the data invalid (Sih, Hubbard & Williams, 2001).
Movements or activities, which contain transversal rotation, can cause errors regarding the measurement of angles. This is due to the movement being performed out of plane e.g. a cerebral palsy child with excessive femoral rotation during a gait cycle. Nielsen and Daugaard (2008) stated when rotation over 20° occurs a mathematical correction can be conducted, in order to improve the validity of the data. This suggests that under 20° of rotation the accuracy of data collected by 2D software is maintained while over that threshold the validity of data is reduced.
Therefore the aim of this study is to investigate at what degree sporting movements/recordings out of the field of view produce inaccurate data. It was hypothesised that as the activity moves further from the perpendicular plane to the camera, the accuracy of the data will be reduced.
Methods
Testing procedures.
The study used a calibration board (39cm x 31.5cm) that consisted of 5 reflective markers (12.7mm) attached in all four corners and directly in the middle of the board (Figure 1). The board was placed at one-metre intervals (1-7) from a Quintic USB2 LIVE High-Speed Camera (Quintic Consultancy Ltd, Sutton Coldfield, UK). At each interval the markers were recorded at six different angles to the camera. Each placement began directly perpendicular to the camera noted as ‘0°’, then at 5° intervals, up to 25°.
Data collection and analysis.
Using one Quintic USB2 LIVE High-speed camera (placed on a fixed wall mount 88.5cm above the ground) the calibration board was recorded at 100fps for 270 frames at each angle parallel to the camera (0 – 25°) at each specific distance (1 – 7 metres from the camera). The recordings were analysed on Quintic Biomechanics video analysis software (Quintic Consultancy Ltd, Sutton Coldfield, UK). Two-dimensional scaling prior to digitisation was carried out using two-dimensional calibration. A five point automatic digitisation of all 270 frames was undertaken to determine angles and lengths of the markers.
Data handling.
Calculated variables from the five-point template included 8 angles and 3 lengths. These were then analysed within the Quintic Biomechanics v26 software. For all variables, Butterworth filters were used to smooth the data. Optimum filter values for each individual variable, in each axis were calculated in the Quintic Biomechanics v26 software. Nine one-way ANOVA’s were completed to determine if there was a statistical difference for each of the six angles and three lengths. The angle and length for each trial were represented by the average for the completed trial (Table 1 & 2)

Figure 1. Location of angles calculated from 1 – 6, including vertical and horizontal
Figure 2. Location of lengths calculated.
Results
Angles 1, 3, and 6 show a progressive increase in the angle produced as the angle orientation to the parallel increased from 0° to 25°. Angles 2, 4, and 5 produced a progressive decrease in angle as the orientation increased from 0° to 25°. Angle 2 showed the greatest change in average angle produced with a difference of 6.16°. The vertical distance shown in table 2 produced the smallest difference in length as the orientation angle changes at 1cm compared to the horizontal and Pythagoras length changed 2-3cm from 0° – 25° orientation to the camera.
Table 3 represents the P value of the One-way ANOVA. Each angle or length calculated except the vertical length and angle 5 produced a P value of 0.05 or greater, in most cases p < 0.001. The vertical length and angle 5 were the only values that did not produce a significant P value at .409 and .939 respectively.

Table 1. Average angle produced at varying degrees from parallel.
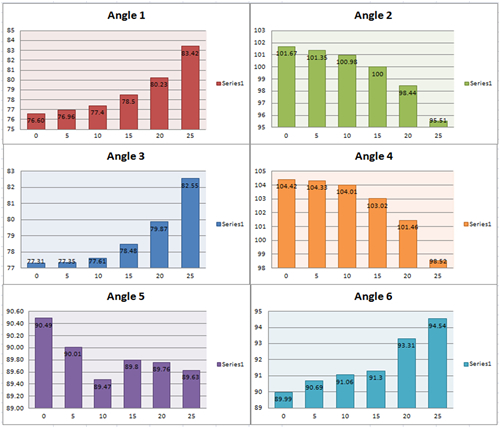
Figure 3. Average angle at each degree interval from parallel to camera.

Table 2. Average length produced at varying degree from parallel.

Figure 4. Average length graphs at each degree interval from parallel to camera.

Table 3. ANOVA P. values for the angles and lengths produced at each variable.
Discussion
It was hypothesis that as the markers moved out of plane relative to the camera the accuracy of the data would reduce. As seven out of the nine one-way ANOVAs produced significant P values (P > 0.05) it is suggested that the difference in the results produced at parallel (0°) compared to the other orientation angles was not caused due to random effects. As the activity moved ≥ 20° out of the calibrated plane the data became inaccurate, which follows the results found by (Nielsen and Daugaard 2008).
The angles presented in table 1 and figure 3 present a trend of progressive increase or decrease (depending on the variable) as the orientation from 0 – 25 increases. The data highlights that although there is a general pattern the degree of change in data increases at 20° and 25° (Figure 3 and table 1). This increase in rate of change in data would seem to show the affect that transversal rotation has on accurate data collected, in a two-dimensional format. Each data point moves progressively further from the original data point at 0°, however angle 5 does not follow this progression. In particular figure 3 at 10° orientation, the average angle is lower than that produced at 15, 20 and 25 degrees. This extreme data point, which skews the data, suggests that this anomaly is the reason angle 5 is the only angle data point not to produce a significant P value (< .939). If this point was removed then it is likely that angle 5 would match the result pattern of the other data point. Therefore the data point should not be used in the overall conclusion and validation of the software
While the One-way ANOVA confirmed the hypothesis that as the calibration board moved out of plane the data would become invalid, the test did not statistically confirm at which exact angle the data was significantly different from data collected at 0°. For this to be confirmed further statistical analysis is required in future research.
Conclusion
The results have shown that while perspective and parallax error can lead to inaccurate data, the Quintic two-dimensional biomechanics software can accurately calculate both various angles and lengths at less that 20° out of parallel, which supports previous research. However the results all highlight the fact that accurate methodology and set up of equipment in a biomechanical stand point is essential to ensure that the activity being recorded occurs in the correct plane of view so that data is collected as accurately as possible.
References
1. Nielsen, D. B., Daugaard, M. (2008). Comparison of angular measurements by 2D and 3D gait analysis. Jönköping. Thesis, 15 HP.
2. Churchill, A. J. G., Halligan, P. W. & Wade, D. T. (2002). RIVCAM: a simple video-based kinematic analysis for clinical disorders of gait.Computer Methods and Programs in Biomedicine. 69, 197-209.
3. Kirtley, C. (2006). Clinical gait analysis; Theory and practice. Philadelphia: Elsevier.
4. Sih, B.L., Hubbard, M. & Williams, K. R. (2001). Technical Note: Correcting out-of-plane errors in two-dimensional imaging using nonimage-related information. Journal of Biomechanics, 34, 257- 60.
Downloads:
|
~1.0 MB |