|
Q4E Case Study 16 – Velocity Proposed Subject usage: Introduction The SI unit is the modern metric system of measurement. All systems of weights and measures, metric and non-metric are linked through a network of international agreements supporting the SI units. The SI unit defines seven base units. From these all other physical units can be derived. The common SI unit for displacement is metres (m) and the SI unit for time is seconds (s) therefore velocity is usually measured in metres per second (ms‾¹). However, any unit of length divided by any unit of time yields an acceptable unit of velocity e.g. km/hr. The basic equation for velocity is:
If the beginning and end velocities of a motion are known, and the acceleration is constant, then the average velocity can be calculated with the following: 
When an object is thrown or propelled into the air, it follows a curved path, which is known as projectile motion. Projectile motion can hence be defined as the motion of a moving object with a constant force acting upon it. In order to calculate projectile motion, it is divided into two components, horizontal motion and vertical motion. Horizontal motion of a projectile moves at a constant velocity covering equal distances in equal time intervals. This is due to the fact that it has no major forces acting on it with the exception of air resistance though this is usually ignored. Vertical motion however, changes with whatever acceleration the force exerts i.e. force of gravity (9.81ms‾²). Horizontal and vertical components are independent of each other. Objectives
|


Methods
The videos have been digitised and calibrated using the Quintic software.
- Butterworth filters were used to smooth the raw data.
- Data has been exported to an excel file where it was used to calculate linear velocity, horizontal velocity and vertical velocity. Graphs have been prepared using this information.
- Still images have been captured from videos to outline different stages of the exercise.
Functions of the Quintic Software used:
- Multi-Point Digitisation Module
- Butterworth Filter
- Calibration
- Interactive Graph and Data displays
- Export Data
- Multi-Image Capture
Results
All the different velocities (linear, horizontal and vertical) from the four activities – bench press, long jump, golf putt and swimming, were analysed using single point digitisation. Every frame of the skill was digitised from the start of the movement until the end.
 |
Figure 1: Velocity (linear, horizontal and vertical)
Bench Press, Long Jump, Golf Putt and Swimming Dive

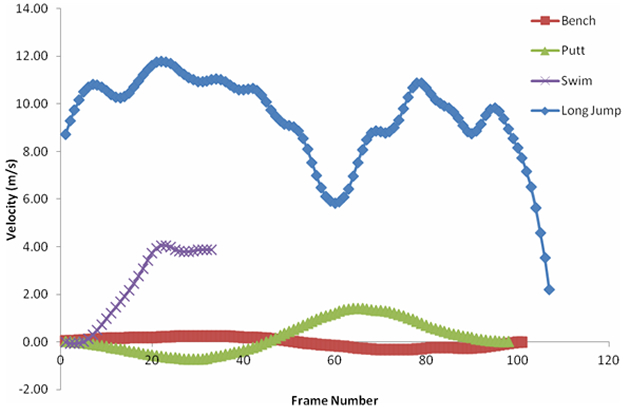
Graph 1: Linear Velocity
Graph 1 shows the linear velocities of the different sports. The greatest linear velocity occurred in the long jump, 11.79ms‾¹, followed by the swimmer with a velocity of 6.26 ms‾¹. The other two values had lower maximum linear velocity values, 1.2ms‾¹ and 1.42ms‾¹ for the barbell and golf club respectively. The reason for this can be seen when the velocity is broken down into the two components of horizontal and vertical velocity.
As stated in the introduction, velocity is a vector and has both magnitude and direction. All horizontal and vertical velocity graphs show the component velocity in that respective direction. However the linear velocity graphs only slow the magnitude of the velocity. The direction of any linear velocity is given by the resultant sum of horizontal and vertical velocities.
The golf club has one of the lowest linear velocities. In figure 1 below we look at the movement of the golf club. A small grid was drawn to outline the initial position of the golf club (picture 1). As the video progresses to the top of the swing (picture 2) a blue line was draw. Using the initial grid and the blue line, we can see that at the top of the back swing the club has only lifted minimally, 0.06m, off the ground and horizontally has only moved a distance of 0.34m. A similar situation is seen at the end of the follow through (picture 4) with the club 0.07m above ground level and 0.29m away from initial position.
 |
Figure 2: Golf Putt
 |
Graph 2: Horizontal Velocity
The second graph shows just the horizontal velocities of the skills. Again as expected the long jump has the highest horizontal velocity in the shortest period of time, 11.78ms‾¹, due to the fact that the long jumper is mainly travelling horizontally. When looking at the other sports we see that the barbell has minimal horizontal velocity reaching a maximum value of 0.26ms‾¹. This is because the bench press is virtually a ‘straight up-straight down’ exercise with little movement forward and back. The golf club has a negative horizontal velocity for a short period due to the initial direction of the swing. During the back swing the golf club is travelling in a negative direction creating a negative horizontal velocity. This velocity returns to zero when the golf club reaches the top of the back swing. From then on, the club is travelling in a positive direction thus has a positive velocity.
Looking at the bench press, graph 3 and figure 3 shows why there are such negligible changes in the horizontal velocity. In the pictures below, a vertical line was drawn at the start of the movement through the centre of the barbell. Still pictures were taken at various stages throughout the exercise and using this line as a reference point we can see that there is little horizontal movement of the barbell. During the first part of the exercise, as the arms are being flexed, the barbell is brought slightly forward and more align with the chest. The horizontal velocity increases positively but at midpoint of the exercise it has returned to zero. As the arms are being extended, the barbell is returning to its initial position. The horizontal velocity is increasing again but this time in a negative direction as the barbell is travelling in the opposite direction. Towards the end of the exercise, the horizontal velocity is returning to zero.
 |
Figure 3: Bench Press
|
Graph 3: Velocity of the Bench Press
Graph 4: Vertical Velocity |


Graph 4 shows the final velocity component in the vertical axis. This graph offers more of a variation in the values. Again, the long jumper reaches the highest velocity value of 3.06ms‾¹. There is a constant variation initially because of the flexion of the knees and hips in preparation for the ‘push off’ stage of the long jump. As the jumper leaves the ground during the flight time of the jump, vertical velocity increases. The barbell initially has constant negative values because of the starting position. When the arms are fully extended the vertical velocity is zero therefore when the bench press is executed the barbell is moving downwards i.e. a negative direction, and as mentioned earlier if an object moves in a negative direction then it will have a negative velocity. At midpoint in the exercise, the velocity returns to zero as the barbell is not moving. When the arms are being extended, the velocity increases positively as it is travelling in the opposite direction. The golf club has negligible vertical velocity, 0.35ms‾¹, due to only a slight vertical movement of the golf club during the swing.
Taking a closer look at the long jump, from figure 4 and graph 5, we can see the hip movement during the jump. The red line in figure 4 represents the initial hip height (picture 1). We can see that as the video progresses (picture 2) the hip drops slightly below the line causing the depression in the vertical velocity values. Then as the athlete enters into the push off stage (picture 3) the hip returns to its initial height. During the flight time (picture 4), the hip rises above the line and the vertical velocity increases. Graph 5 displays this velocity also. The blue line represents zero velocity, and as the hip drops, the vertical velocity goes below zero.

Figure 4: Long Jump
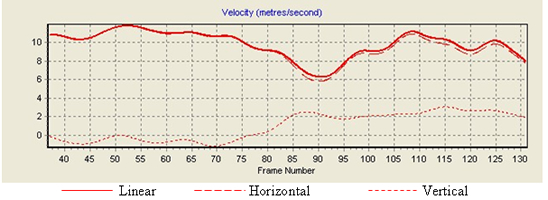
Graph 5: Velocity of Long Jump
The value that stands out most is the vertical velocity of the swimmer. If an object lands, or is caught, at precisely the same height from which it was projected then the final velocity of the object is exactly the same as the initial velocity with the only difference being that the direction is reversed i.e. its changed from a negative direction to a positive direction or the other way round. Therefore, it stands to reason that if the object is projected from a height and lands below the point of release that this will affect its final velocity. Firstly, it will result in a negative velocity as the object goes past the point of release and secondly it will lead to an increased velocity because the speed of the object progressively increases due to the force of gravity. Hence, in this case the final velocity is not equal to the initial velocity.

Graph 6: Vertical Velocity of Swimmer
PoR = Point of Release. Represents the point where the swimmer continues in motion past the height where she dived from.
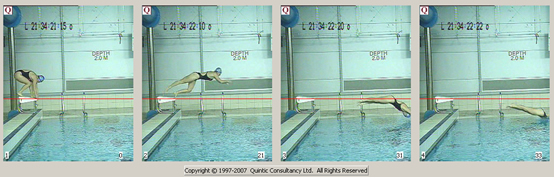
Figure 5: Swimming Dive
The pictures below show four different stages of the dive:
- Start of dive (0 Vertical Velocity)
- Above point of release (+ Vertical Velocity)
- At same level as point of release (0 Velocity = same velocity as start of dive)
- Entering water below point of release (- Vertical Velocity, increased velocity)
Conclusion
In conclusion, we can see from this analysis that velocity is a major part in an athlete’s technique. It tells us at what speed an object/person is moving at and in which direction. Being able to evaluate each of the components of velocity separately (horizontal and vertical), we can see in greater detail the effects that external forces have on our technique e.g. gravity, and use this information to our advantage to try and improve the execution of a skill.
The ability to calculate velocity is a very useful tool for coaches to have as it will allow them to have a deeper analysis of a performance and improve it. As for teachers, being able to apply the laws of kinematics to such videos as shown above will give students a clearer demonstration of the velocity mechanism. Being able to associate the laws of velocity with a visual aid (Quintic Video anlaysis software) will give students a better understanding in seeing how it applies to everyday life thus promoting better learning.