Q4E Case Study 13 – Equations of Motion
Proposed Subject usage:
Mathematics / Physics (A/AS level), Sports Science (Degree Yr 1/2)
Introduction
The equations of motion are used to describe various components of a moving object. Displacement, velocity, time and acceleration are the kinematic variables that can be derived from these equations. There are three equations, which are also referred to as the laws of constant acceleration, and therefore can only be applied when acceleration is constant and motion is constrained to a straight line. The three equations are
-
v = u + at
-
v² = u² + 2as
-
s = ut + ½at²
Where
u = initial velocity (ms‾¹)
v = final velocity (ms‾¹)
a = acceleration (ms‾²)
t = time (s)
s = displacement (m)
The first equation is a velocity-time equation. If acceleration is constant, this implies that there is a uniform rate of change of velocity. The longer acceleration is occurring, the greater the change in velocity is. When acceleration is constant, the rate of change of velocity is directly proportionate to time. If there is no acceleration present, final velocity is equal to initial velocity. The second equation is a velocity-displacement equation. When the initial velocity is zero, and acceleration is constant, displacement is directly proportionate to velocity squared. The third equation is a displacement-time equation. The change in displacement of an object is directly proportionate to the square of time when acceleration is constant and initial velocity is zero.
A projectile has only two forces acting on it, force of gravity and air resistance. The force of gravity only influences vertical velocity, and is a constant value of 9.81ms‾². Air resistance influences horizontal velocity, but is generally ignored due to its effect being negligible. A projected object, that is released and lands at the same height, has the same initial and final velocity. In addition, the time taken to reach the apex is half the total time of the motion i.e. time to peak height is ½t, when initial and final height are the same. When trying to find the peak height of an object, the final velocity (v) is taken as 0ms‾¹. This represents the apex, as velocity returns to zero when the projectile is changing direction to come back down. Similarly, if an object is dropped from a height, the initial velocity (u) is taken as 0ms‾¹.
Objectives
- To calculate velocity, acceleration, time and displacement of a tennis ball serve and a netball shot using the equations of motion
Methods
- The videos have been digitised and calibrated using the Quintic software.
- Data has been exported to an excel file where it was used to calculate linear acceleration, horizontal acceleration and vertical acceleration. Graphs have been prepared using this information.
- Still images have been captured from videos to outline different stages of the exercise
Functions of the Quintic Software used:
- 1 Point Digitisation module
- Calibration
- Interactive graph and data displays
- Export data
- Multiple image capture
Results
The two videos, from the activities tennis and netball, were analysed using single point digitisation. Every frame was digitised from the release of the ball until the end of the video.
 |
The two activities that were analysed was the ball toss in a tennis serve and a goal shot in netball. In both of these skills, the ball is vertically projected and once in the air has only the force of gravity acting on it.
|
Tennis Serve |
Netball Shot |
|
| Initial Velocity (ms‾¹) |
5.30 |
4.71 |
| Final Velocity (ms‾¹) |
-1.37 |
-2.75 |
| Distance to Max Height (m) |
1.43 |
1.13 |
| Time to Reach Max Height (s) |
0.54 |
0.48 |
| Distance from Max Height to end (m) |
0.10 |
0.38 |
| Time from Max Height to end (s) |
0.14 |
0.28 |
| Total Distance (m) |
1.53 |
1.52 |
| Total Time (s) |
0.68 |
0.76 |
Table 1: Results
Graphs 1 and 2 show the velocity of the balls in a tennis ball toss during a serve and a netball shot respectively, while graphs 3 and 4 show the distance travelled by the balls. The highlighted areas show the change in the velocity and distance for their respective graphs. The pictures beside the graphs show the path of the balls for the same frames.
Vertical velocity of the ball at peak height, in both of the skills, is zero. When calculating the initial velocity, time or displacement of these activities, from point of release to peak height, the final velocity is zero. Thus, if calculating the final velocity, time or displacement from the peak height until landing, the initial velocity is zero. In addition, when an object is projected, the only force acting on the vertical velocity is the force of gravity (9.81ms‾²) so acceleration for the vertical component of a projectile is always 9.81ms‾².
 |
Graph 1: Tennis Velocity
Initial velocity of the ball during the serve can be calculated using the first equation of motion
v = u +at
Graph 1 shows the velocity of the tennis ball throughout the toss. The highlighted area shows the velocity of the ball from point of release to peak height. The initial velocity, when the ball is released at frame 35, is 5.30ms‾², as calculated from the equation. As the tennis ball increases in height, velocity decreases due to the force of gravity acting in the opposite direction to the tennis ball, causing it to slow down. This eventually results in the velocity returning to zero (frame 62), which indicates the peak height of the tennis ball. The time taken for the ball to reach the peak height is 0.54s.
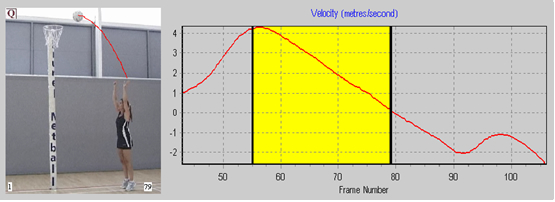 |
Graph 2: Netball Velocity
Initial velocity of the goal shot was calculated also using the first equation of motion
v = u +at
Graph 2 shows the vertical velocity of the netball with the highlighted area showing the velocity from point of release until peak height. Similar to the tennis toss, from once the ball is released the velocity, which is initially 4.71ms‾², is constantly decreasing due to gravity until the ball reaches the peak height and velocity is zero. The time taken for the ball to reach the peak height is 0.48sec.
The displacement of the ball, from point of release until max height, can be measured using either the second or the third equation of motion, depending on the values known.
 |
Graph 3: Distance of Tennis Ball
Displacement of the tennis ball is calculated using the second equation of motion.
v²= u² + 2as
Graph 3 shows the vertical distance travelled by the ball. The distance travelled is only calculated from frame 35, as this was when the ball was released and only had the force of gravity acting on it from that point on. The initial velocity has been calculated previously and the final velocity is zero. Acceleration is 9.81ms‾², thus the distance is calculated to be 1.43m.
 |
Graph 4: Distance of Netball
Displacement of the netball was calculated using the third equation of motion.
s = ut + ½at²
Graph 4 shows the vertical distance of the netball. The distance is calculated between frames 55-79, as this shows the distance from where the ball is released until it reaches peak height. The initial velocity was calculated from the first equation, acceleration is 9.81ms‾² and time is 0.48sec. The vertical distance of the ball was found to be 1.13m
Final velocity and distance from peak height to the end can be measured using the same equations. When measuring from peak height to the end, the initial velocity is zero.
 |
Graph 5: Distance and Velocity from Peak Height to end
Graph 5 shows the distance and velocity of the ball from the peak height in frame 62 until impact with the racket in frame 69. Velocity of the ball is negative due to the direction the ball is travelling. Also, as it is the vertical distance that is measured, distance is measured in relation to height above the ground. Thus, as the ball changes direction and starts to move towards the ground, its height decreases and hence the distance decreases. The final velocity of the tennis ball is calculated to be -1.37ms‾¹, while the distance from the peak height to final velocity is 0.10m. The total displacement of the tennis ball is the sum of the distance travelled from point of release to peak height to impact with racket, and is 1.53m.
 |
Figure 1: Tennis Serve
Figure 1 shows the various stages of the tennis serve. The first picture is where the ball is released; initial velocity is calculated at this point. The second picture shows the ball midway to peak height. The third picture has the ball at peak height, velocity is zero at this point and the final picture is just before the ball is struck with the racket, where the final velocity is calculated. The total displacement is the distance traveled by the ball from picture 1 to picture 4.
 |
Graph 6: Distance and Velocity from Peak Height to end
Graph 6 shows the distance and the velocity of the netball from the peak height in frame 79 until the ball enters the goal enters the goal in frame 92. Similar to the ball toss in tennis, the distance is decreasing due to it being vertical distance that is measured. In addition, velocity is increasing negatively due to the direction of the ball. The final velocity of the netball is found using the first equation of motion. The calculated final velocity is 2.75ms‾¹. The displacement of the ball for this period is found using the third equation of motion and is 0.39m. Total displacement of the ball during the shot is 1.52m.
 |
Figure 2: Netball Shot
Figure 2 shows the various stages of the netball shot. The first picture is where the ball is released; initial velocity is calculated at this point. The second picture shows the ball midway to peak height. The third picture has the ball at peak height, where velocity is temporarily zero, and the final picture shows the ball entering the goal, where the final velocity is calculated. The total displacement is the distance traveled by the ball from picture 1 to picture 4.
Conclusion
The equations of motion can be used to calculate various kinematic variables but only when acceleration is constant and when the object is travelling in a straight line. As an object is projected, force of gravity is the constant acceleration.
Downloads
|
Written Case Study
|