Q4E Case Study 8 – Performance Analysis Shot Put Technique
|
Proposed Subject usage:
|
||
|
Coaches, Physics A/S, Sports Science (1st/2nd and 3rd year) |
Objective
- To analyse the shot put technique of two Olympic level female heptathletes
Introduction
Two putting styles are in current general use by shot put competitors: the glide and the spin. Both athletes in this case study are using the glide technique. This was invented in the United States in 1876. With this technique, a right-hand thrower begins facing the rear of the circle and kicks to the front with the left leg while pushing off forcefully with the right. The key is to move quickly across the circle with as little air under the feet as possible, hence the name “glide“. As the thrower crosses the circle, the hips twist toward the front, followed by the shoulders and strikes in a putting motion with his arm. Competitors take their throw from inside a circle 7 feet (2.135 meters) in diameter, with a toe board approximately 10 cm (4”) high at the front of the circle. The distance thrown is measured from the inside of the circumference of the circle to where the shot lands at its nearest disturbance of the ground. Each competitor receives a certain number of throws, usually 6 in elite competition, and the competitor with the farthest legal put is declared the winner. In men’s competition, the shot weighs 7.26 kilograms (16 pounds). The women’s shot weighs 4 kg (8.8 pounds). Shot put is not merely heaving a metal ball, it requires immense strength, power, grace, and balance…

Figure 1: The breakdown of Athlete A (Frames 1-6) and Athlete B’s (Frames 7-12) technique.
Method
Video footage was taken at an indoor competition during the 2007 season. The footage was recorded using a Sony DCR-TRV900E camcorder and captured using Quintic Biomechanics Video Analysis Software. The videos were later calibrated in horizontally and vertically by using a calibration grid that was placed in the centre of the shot circle after the competition had concluded. All of the captured clips were then manually digitised, and Butterworth filters were applied to the data, to smooth any errors.
|
Quintic software functions used:
|
Analysis
Release Height:
Shot release height was calculated by using the ruler and calibration functions. The vertical distance was measured between the centre of the shot at release, (Release defined as the last frame that the shot has in contact with the athletes hand) and the surface of the throwing circle.
On average athlete A’s vertical release heights are 1.97m and B’s are 1.85m. This shows a difference of 12cm. This difference in shot release height could be due to individual technique differences. Although a big factor which effects the release height of the shot, is the actual physical difference in vertical athlete A is actually 13cm taller them B.

Figure 2: Vertical release heights of both Athlete A and Athlete B
Angle of Release
Angle of release is important in the shot event as the release speed of the shot decreases when thrown with a higher release angle. The decrease in projection velocity with increasing projection angle is a result of two factors.
1. When throwing with a high projection angle, the athlete must expend a greater effort during the delivery phase to overcome the weight of the shot, and so less effort is available to accelerate the shot (i.e. produce projection speed).
2. The structure of the human body favours the production of putting force in the horizontal direction more than in the vertical direction.
The angle of release was calculated by overlaying an angle to the horizontal over the digitisation trace of the shot. Analysis of the release angles showed athlete B’s average release angle was 41.22º where as athlete A’s was 35.2º. According to current literature for elite shot-putters the optimum projection angle usually lies between 30° and 40°. Therefore we can see that athlete B is currently just outside this range, although ideally more data would be collected on the athlete, before any assumptions can be made. We can also see that there is a 6º difference in the angle of release between athlete A and B.
Table 1: Release angles (º), Total shot distances (m) and Velocity at release (ms-1)
|
Athlete A
|
Round |
Angle of Release (º) |
Velocity at Release (ms-1) |
Distance (m) |
|
1 |
37.13 |
8.97 |
X |
|
|
2 |
37.17 |
10.28 |
X |
|
|
3 |
36.97 |
10.58 |
13.83 |
|
|
4 |
33.26 |
10.63 |
14.42 |
|
|
5 |
34.19 |
10.70 |
14.11 |
|
|
6 |
32.50 |
10.30 |
x |
|
|
Average |
35.20
|
10.24
|
||
|
S.D.
|
2.14
|
0.65
|
||
|
Athlete A
|
Round |
Angle of Release (º) |
Velocity at Release (ms-1) |
Distance (m) |
|
2
|
39.13
|
9.39
|
11.33
|
|
|
3
|
43.31
|
9.40
|
x
|
|
|
Average |
41.22
|
9.40
|
||
|
S.D.
|
2.956
|
0.007
|
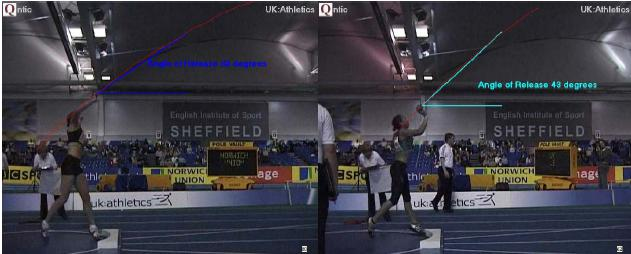
Figure 3: Angles of release for Athlete A (Rnd4) and Athlete B (Rnd3)
Velocity of shot at release
Linear shot velocity as well as, the horizontal and vertical components were calculated by digitising the shot.
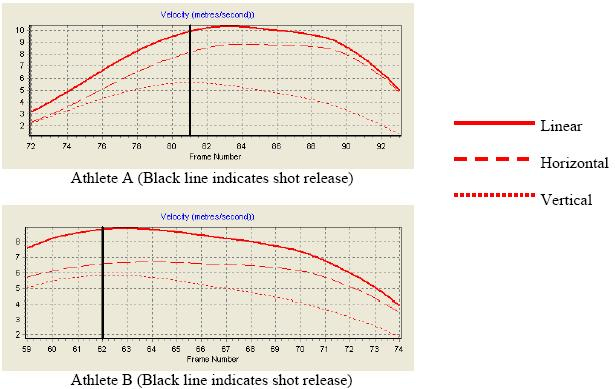
Figure 4: Velocity graphs of athlete A and B
From analysis of the release angle, it can be seen that athlete B has a higher release angle then A, therefore we can assume, that if the relationship mentioned earlier (release angle and release velocity being inversely proportional) is accurate we would expect athlete B to have produced slower release velocities. Appendix A (see download) illustrates the shot velocities 2 frames prior to release through to 2 frames post release. Figure 5 also illustrates this data in a graphical format. The average shot velocity at release was 10.24ms-1 for athlete A and 9.40ms-1 for athlete B. Although this doesn’t seem like a big difference, athlete A’s first round throw decreases her average velocity. Without taking into account round 1, average linear velocity at release would be 10.5 ms-1, 1ms quicker then athlete B. Due to athlete A’s lower release angle we would also expect to see, a quicker horizontal velocity through the technique, as well as a lower vertical velocity, when compared to athlete B. Appendix A also illustrates this on average athlete A’s horizontal velocity of the shot at release is 1.5ms-1 quicker then B’s, where as athlete B’s vertical velocity at release is 05.52ms-1 quicker then A’s.

Figure 5: Athlete A and B’s shot velocities 2 frames pre release to 2 frames post release.
Conclusion
The analysis has illustrated that Athlete A has a lower release angle and faster shot velocity at release. Although as stated earlier, that release height and release velocities are inversely proportional, this cannot be perceived as the only reason to the decrease in shot velocity and shot distance. Anatomical and physiological restrictions (height, power production) could also be a factor, as well as the athlete just not performing well on that day. To be able advise the athlete further, more throw sessions would be filmed, so that more data can be collected and accurate conclusions can be drawn.
Summary
Quintic Software can be used to capture, observe and evaluate video footage of athletes during competition as well as in training. Analysis of their performances can be performed with ease using the wide variety of functions offered by the software. The videos can also be compared with past performances and other athletes, to monitor progress, rehabilitation, and technique differences.
Downloads
|
Written Case Study
|
Excel Data Spreadsheet
|
Video 1
|
Video 2
|
|
~0.8 MB
|
~0.3 MB
|
Athlete A ~1.7 MB
|
Athlete B ~ 2.0 MB
|