Q4E Case Study 4 – Power
|
Proposed Subject usage:
|
||
|
Physics (A/AS level) / Sports Science (1st/2nd year) / Sports Coaches / Strength |
Introduction
| Strength is the athletes’ ability to exert force upon an object. Muscle strength is the maximal force that a muscle can develop and is increased by training with weights of between 75% and 95% of an athlete’s 1RM. The force velocity graph (Figure 1) highlights the fact that maximum force is generated at low velocities. It takes approximately 400ms to generate maximal force. As most athletic movements involve high velocity movements i.e. contact times during a 100m (approx 100ms), the athlete cannot produce maximal force, with strength training alone.
Power is defined by how quickly an athlete can generate their maximum strength. High power outputs can de trained and developed by training at mid velocity and force levels (see force velocity curve). Therefore, it is important for coaches and athletes to train and develop power as this will in turn increase the athlete’s ability to generate both force and velocity. Thus making it more efficient and specific way to train, rather then focusing solely on strength training. |
Figure 1. |

Objective
- To show how video analysis software can be used to calculate power output during a variety of Squat lifts at different weights.
- To calculate the optimal weight for Athlete A to perform front squats at to optimise power output as well as muscular strength and velocity.
Work = Force (mass of the bar) x Distance (Vertical displacement of the bar)
Power = Work / Time
To calculate the power output in a squat the following values must be calculated.
- Measure the vertical displacement of the squat bar through each frame from the bottom of the squat through maximum extension and back to the start position.
- Calculate the time elapsed to complete the full extension phase of the squat then divide this time by the total amount of frames to give a split time (I.e. if the video is recorded at 50fps each frame = 0.02seconds).
- Calculate the mass of the bar in Newtons (n)
Method
Videos were captured at 50hz using the dual camera capture function of the Quintic software. Synchronised videos of the side and front views of both a 20Kg and a 60Kg squat were captured. The videos were then calibrated, and either end of the squat bar where digitised throughout the full movement of the squat so that quantitative data could be exported, for further analysis. All of the quantitative data was then smoothed using the inbuilt butter worth filters module to remove any anomaly, and then exported to excel. Still images were also exported to illustrate the athletes body position at key points i.e. peak power production. Power was then calculated using the formula’s described earlier. Please see the spreadsheet for working out of power output during the 20Kg and 60Kg squats.
Squat bar = 20Kg = 196.133 Newton’s (n) : Time between each video frame = 0.02seconds
Vertical displacement = the vertical displacement of the bar every frame (not overall displacement)
POWER = (196.133 x vertical displacement)
0.02
|
Quintic software functions that were used:
|
Results
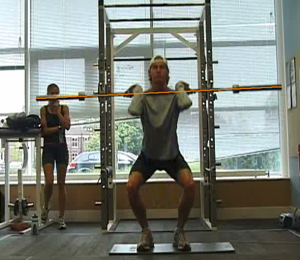
| 20kg squat ; The results for the 20kg front squat show that the peak power output during the movement is 189.05 watts (W) and is produced with a bar vertical velocity of 0.96ms-1 | |
 |
|
|
20kg Squat at peak power output |
20kg Squat at peak power output |
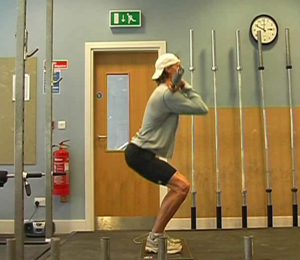
| 60Kg Squat
The results for the 60kg front squat show that the peak power output during the movement is 593.24W with a bar vertical velocity of 0.99ms-1 |
|
 |
 60Kg Squat at peak power
|
Conclusion
The data collected from the 2 squat exercises show that peak power production has increased from 189.05W during the 20Kg squat to 593.24W during the 60Kg squat an increase of 404.19W. The results have also shown that even at the higher load of 60Kg the athlete has maintained the vertical velocity of the bar when compared to the vertical velocities of the 20kg squat.
As the athlete has produced a greater power output while maintaining the vertical velocity of the bar, we can conclude that 60Kg is an efficient weight for the athlete to train at to improve power production as well as speed and muscular strength.
If we were to conduct more lifts with this athlete, at heavier weights we would expect to see a decrease in power, as well as vertical velocity of the bar. This decrease would start to appear due to the velocity force relationship (refer to figure 1).
To improve the accuracy of this study more lifts would be performed around the 60Kg so that a more accurate lifting weight could be identified to improve power. This exercise would also have to be repeated several times throughout the year, to take into account the differing stages of physical fitness throughout the season as well as any detrimental effects injuries may have on the athlete.
Downloads
|
Written Case Study
|
Excel Data Spreadsheet
|
Video avi. files
|
|